Disclaimer: The information and commentary presented in this website is for educational and entertainment
purposes only and not meant to be interpreted as trading or investment advice.
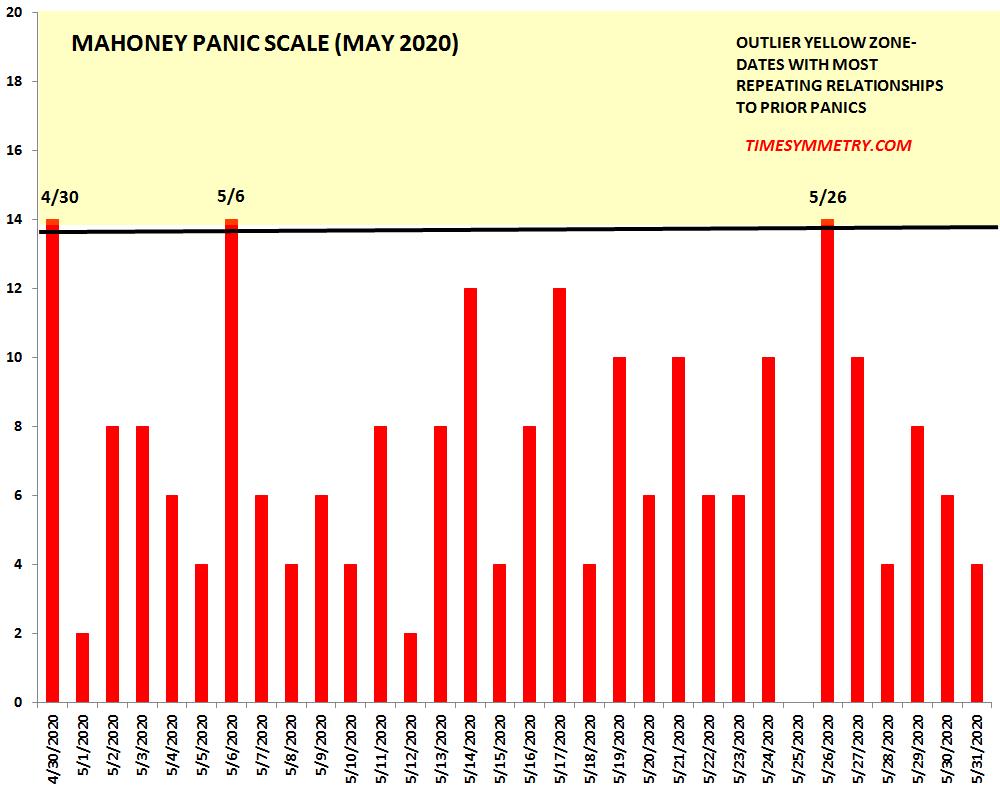
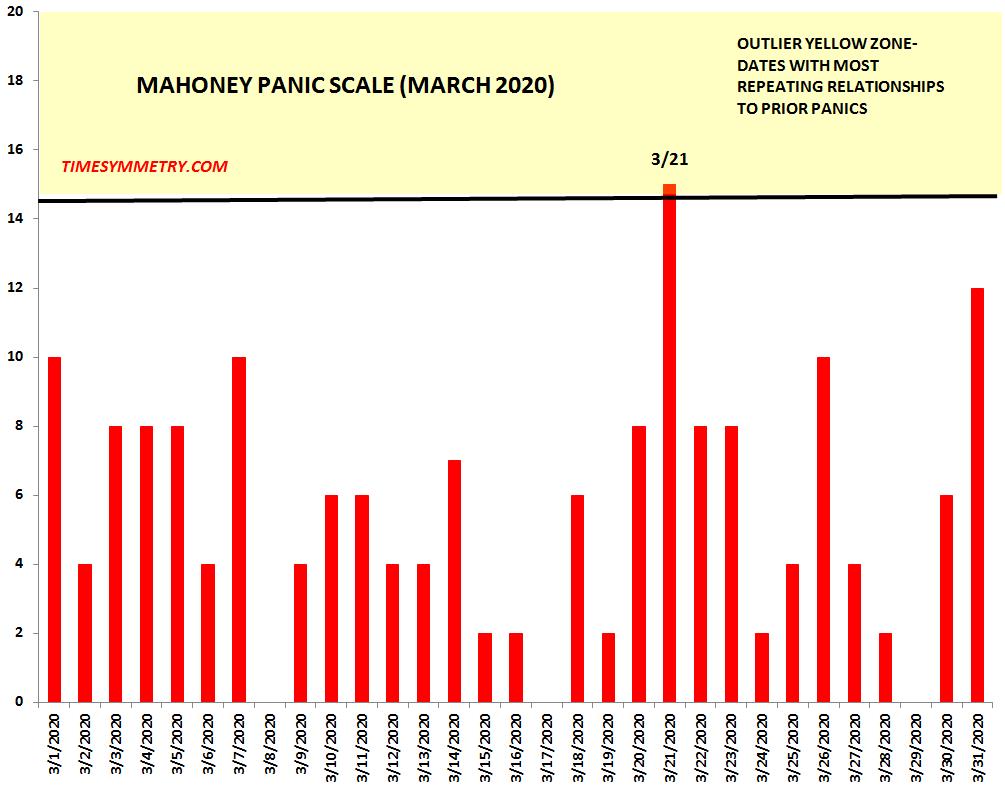
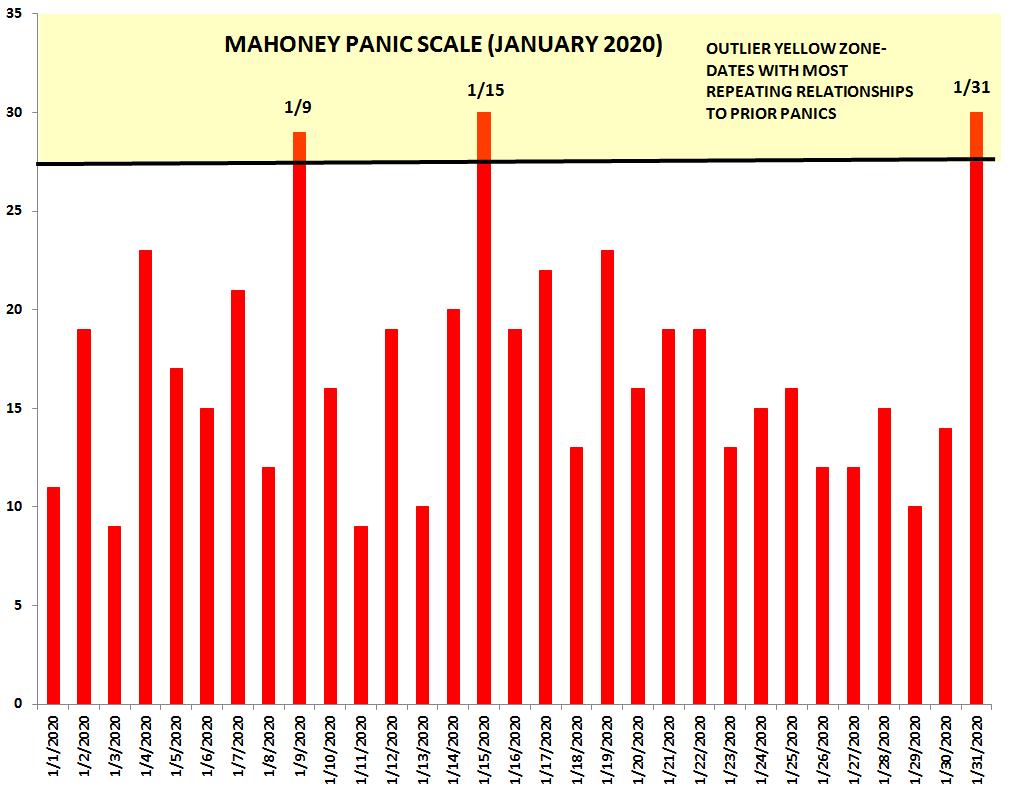
My theory is that not all panics and crashes are random events. Some panics are cyclical
and related. If so, many panics should tend to occur on those dates that have strong
cyclical and "other" relationships to prior panics. The Panic Scale measures the intensity
of those relationships.


The inputs for the Panic Scale in February, and moving forward, have been refined and reduced. This will result in
lower numbers on the graph than prior years.


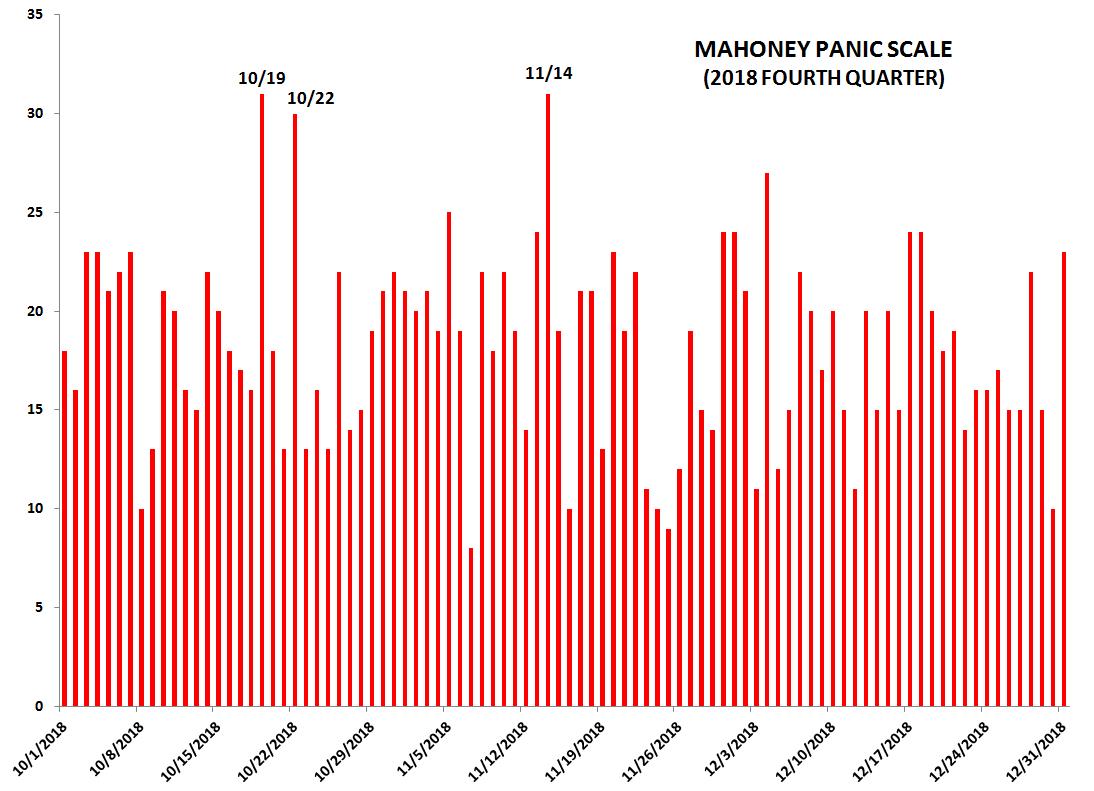
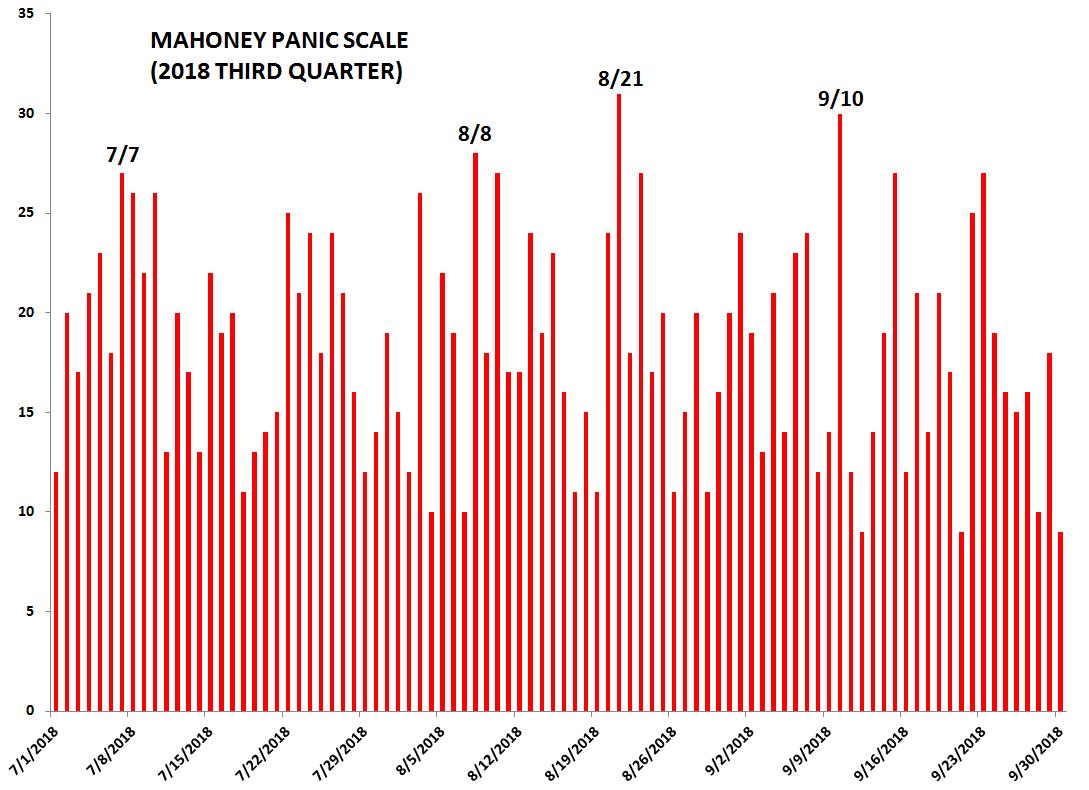
If there's going to be an autumn panic/crash this year, it will most likely occur in the
10/19 to 10/22 timeframe.


.

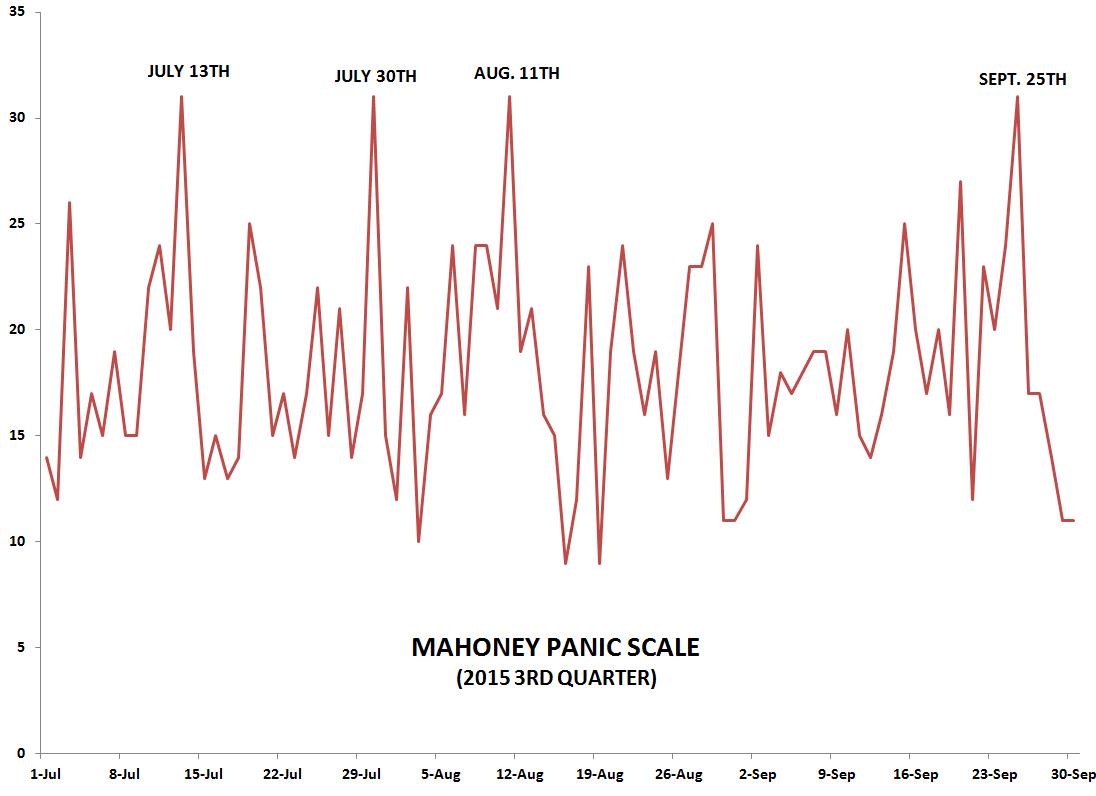
3rd quarter panic scale with updated comments below:

Business headlines from May 29th, 2015 below:


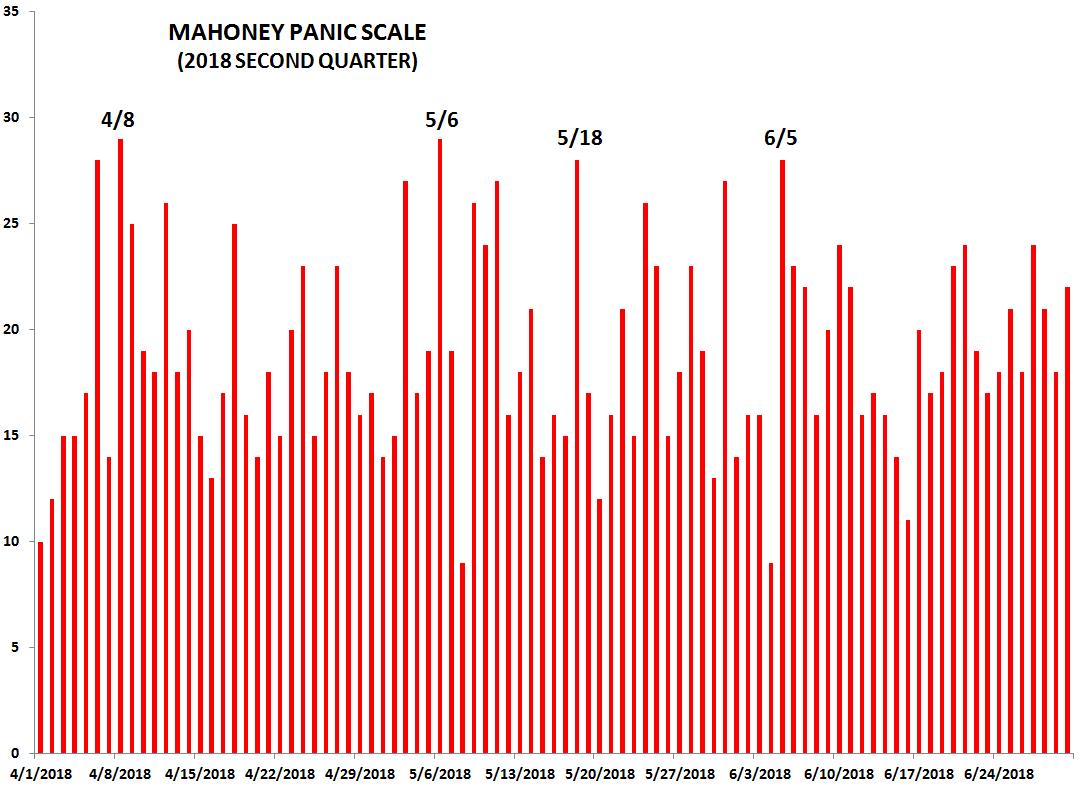
May 26th, 2015 update: We're entering the timeframe for the next peak in the panic scale into June 2nd. When I originally posted the second quarter panic scale a couple months ago, I used a five day sum total of panic hits because I wasn't seeing any big one day spikes. I'm now including a more detailed chart which shows the individual one day spikes that make up the the five day sum chart. As I've looked at the data more closely, however, I can see that the panic signatures for 5/29 are in a tight enough alignment to qualify for a big one day spike in the indicator. So, 5/29 appears to be the point of maximum intensity in the panic scale over the next week.

Since there are no extreme one day spikes on the panic scale for the next few months, the panic scale for the 2nd quarter of 2015 is in the format of a five day sum total of daily hits (shown above). The few days leading into March 31st and June 2nd have the highest five day sum total of panic hits for all of 2015.
The Mahoney Panic scale is an indicator created to measure the potential for panic selling in financial markets and is culled from nearly 200 years of stock market data and financial panics. There was no panic selling in August, however, the market did correct into the August 5th time window. Mid-December is the next important time period on the panic scale. January 2015 update: the 12/18 target date resulted in a buying panic as major indices sold off into 12/16 and then had the largest two day gain in over three years, rallying over four percent on 12/17 and 12/18.

If stock market panics are not random events, they should share certain characteristics or commonalities and exhibit tendencies to repeat in a cyclical manner. Each day can be assigned a number, based on these commonalities, and the strength of its cyclical relationship to previous panics. Those dates with the strongest cyclical relationships to previous panics are most vulnerable to panic selling.
|